ADD THE SLIDER CODE HERE

Sunday, July 31, 2011

more research on blood splatters!

Angle of Impact

How Blood Drops Elongate

The narrow end of the splatter is in the direction of the travel.

Convergence of blood splatters

This is used when the blood splatters are from different directions, from the same source. The 'lines' must be drawn from a top view, to a three-dimensional position of the source.

Friday, July 29, 2011

blood spatter!

Analysing blood stains and spatters can help forensic scientists determine how & where the crime was committed. Blood stains have different shapes and sizes. This is because of the different ways the stain is created (ie. angle of impact, direction, force of impact, etc.). They are very useful to an investigator and may be able to provide conclusively the:


  • Movement and direction of persons or objects while they were shedding blood.
  • Position of persons or objects during bloodshed.
  • Movement of persons or objects after bloodshed.
  • The mechanism or object used to create a specific pattern.
  • The direction a stain was traveling when it was deposited.
  • The area of origin of an impact pattern.
  • The minimum number of impacts during an incident.
  • The sequence of events.

All blood droplets fall as spheres, due to surface tension. When they impact on a surface, they form an elliptical or circular stain.


  1. What is shape of blood splatter?
    1. Splatter 1: Irregularly shaped, rounded edges. 
      Splatter 2: Mostly circular, series of smaller drops in the direction of the larger drop below. 
      Splatter 3: Circular, with ‘spiked’ edges. 

      Splatter 4: Elliptical shaped stains, with trails dripping downwards.
  2. Describe any other characteristic of the splatter.
    1. Splatter 1: Concentrated at the bottom, with smaller drops surrounding it.
      Splatter 2: Concentrated at the bottom left, mostly, with smaller drops surrounding it.
      Splatter 3: Larger, more ‘spread out’ (no concentrated areas). Series of small drops from the left, largest drop to the right.
      Splatter 4: Entire series of large splatters against a vertical surface. 
  3. What are the factors that affect the shape of the blood splatter? Name as many as possible.
    1. Direction of splatter
    2. Angle of impact
    3. Force of impact
    4. Distance of impact (similar to force?)
    5. Speed of blood dropping
  4. Generate some hypotheses from the blood splatter patterns observed above.
    1. The larger the impact of the splatter, the larger and less concentrated the stain. 
    2. The greater the angle of impact, the more elongated the splatter (ie. Splatter 4).

Experiment 1
Aim: 
To investigate how the diameter of the blood stains vary with the height
Apparatus: Retort stand, dropper, metre rule, protractor, clipboard, paper, artificial blood (70ml hot water + 25 g flour + food colouring), newspaper.

Procedure:
1. Lay the floor with newspaper to
Setup of Experiment 1
prevent the blood from staining the floor.
2. Attach an A4 paper onto the clipboard and place it on the floor.
3. Place the dropper loosely between the clamp on the retort stand 10 cm above the paper as shown. DO NOT SQUEEZE YET !
4. Slowly tighten the clamp to allow only ONE drop of blood to drip onto the paper below.
5. Measure and record the diameter of the blood stain in the table below. (Is one measurement of the diameter enough?)
6. Label the blood stain as “A10”.
7. Repeat Step 4 and 5 to obtain another blood stain on another spot of the paper and label it “B10”.
8. Repeat steps 3 to step 6 by adjusting the vertical distance for 30 cm, 60 cm, 100cm, 150 cm and label them appropriately.
9. Plot a graph of average diameter of blood stain, d against vertical distance, s using "Numbers".


Height/cm

LA / mm

LB / mm

LAve / mm

WA / mm

WB / mm

WAve / mm

10
8
8
8
8
8
8
30

10
10
10
10
10
10
60
11
11
11
11
11
11
100

13
12
12.5
13
12
12.5
150
13
13
13
13
13
13


Experiment 2
Aim: Investigate how the shape of the blood stains vary with the angle of impact
Procedure:
1. Lay the floor with newspaper to prevent the blood from staining the floor.2. Attach an A4 paper onto the clipboard 
Setup of Experiment 2
place it on the floor.
3. Place the dropper loosely between the clamp on the retort stand least 100 cm above the paper as shown.DO NOT SQUEEZE YET !4. Elevate the clipboard to 10° as shown.5. Slowly tighten the clamp to allow only ONE drop of blood to drip onto the paper.6. Measure and record the length, L and width, W of the blood stain in the table below.7. Label the blood stain as “P10”.8. Repeat Step 5 and 6 to obtain another blood stain on another spot of the paper and label it “Q10”9. Repeat steps 4 to step 8 by adjusting the vertical distance for 30°, 50°, 70° and label them appropriately.


Angle of elevation / °

LP / mm

LQ / mm

LAve / mm

WP / mm

WQ / mm

WAve / mm

10
12
13
12.5
13
14
13.5
30

12
12
12
15
15
15
50

10
10
10
18
18
18
70

23
24
23.5
7
6
6.5


Here are the graphs! (plotted using data collected in the tables)


Experiment 1

Experiment 2


Thursday, July 28, 2011

chromatography!

Chromatography is a physical separation method in which the components of a combination are separated by difference in their distribution between two phases, one of which is stationary and the other is mobile, moving in a definite direction.


The results are due to the different solubilities of every substance. More soluble substances would travel faster on the chromatography paper. 


Rf value=Distance moved by substance/Distance moved by the solvent

Same dyes/substances will have the same Rf value under identical conditions, which is how substances can be identified through their Rf values.


I was absent on the day, so I borrowed data from my friend:


2.9/9.9= 0.292(to 3sf)

Monday, July 25, 2011

flame test!

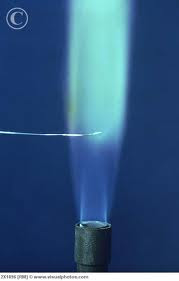
Metals change the colour of the flame when heated in the flame. Different metals give different colours, so the flame test would be able to identify the elements in a sample. The different colours are due to the different wavelengths of the photons of different elements. This will then produce different frequencies, which according to the principle of the atomic emission spectrum is why the colours vary in different metals.


We tested using 6 different metals, and 1 additional one being a metal we have tested during our Chemistry module last year. 


Barium: Pale green
Calcium: Orange-red
Copper: Blue-green
Lead: Blue
Potassium: Pink
Sodium: Bright orange/yellow
Magnesium: Bright white


Here are the photographs of the flame tests for the different substances. As my camera was not able to capture the colours very well, I found some photos on the Internet instead. 


Barium
(
http://www.visualphotos.com/image/1x8465577/barium_flame_test)

Calcium
(http://www.sciencephoto.com/media/4989/enlarge)

Copper
(http://chemistry.about.com/od/firecombustionchemistry
/ig/Flame-Tests/Flame-Test---Copper-Sulfate.htm
)

Lead
(
http://chemistry.about.com/od/firecombustionchemistry/
ig/Flame-Tests/Lead-Flame-Test.htm
)

Potassium
(http://www.chemistry.wustl.edu/~courses/genchem/
Labs/IonExchange/Flame.htm
)

Sodium
(
http://chemistry.about.com/od/firecombustionchemistry/ig/
Flame-Tests/Flame-Test---Sodium-Carbonate.htm
)

Magnesium
(http://www.bbc.co.uk/schools/ks3bitesize/science/chemical_material_
behaviour/compounds_mixtures/revise5.shtml
)


Another more organised diagram of the different colours created by the different metals. 


Saturday, July 23, 2011

fingerprint database!

We also used ink to create a "fingerprint database", which is pretty cool, actually. The patterns on our fingerprints are very clear. These patterns comprise of 3 main types: arches, whorls and loops. Composite patterns are a mixture of the 3 common patterns.


Here is my fingerprint database! (Click to enlarge!) What I realised was that 9 of my fingers have a loop pattern, while only my left middle finger has a arched pattern. Interestingly, the database arranged the fingerprints such that they corresponded to the 'opposite' finger on the other hand. (ie. the right thumb is above the left little, so on) This made me realise that my fingerprints on the same finger on the different hands were 'opposite'. (ie. the right thumb had a loop entering from the right, the left thumb had a loop entering from the left) I find this quite cool, although I don't know the reason behind it and there probably isn't one.
According to the US database,

  • 60-65% are classified as loops
  • 30–35% are classified as whorls
  • 5% are classified as arches
The data gathered from my class, 210, is presented into a graph below. 


2102arches
2101loops
2104loops
2105loops
2106loops
2106loops
2107loops
2108loops
2109loops
21010loops
21013loops
21015loops
21016loops
21019loops
21025loops
21025loops
21026loops
21029loops
21030loops
2103whorls
21010whorls
21011whorls
21012whorls
21017whorls
21018whorls
21020whorls
21021whorls
21023whorls
21024whorls
21027whorls
21028whorls
21031whorls
21032whorls


The graph shows that the data we collected is rather similar to the US data. Our pool of data, while not that large, is already able to show the distribution of fingerprint patterns.